
The Calgary real estate market shifted notably in August 2025 as higher inventory levels met softer sales activity. This balance is easing the seller-driven conditions we’ve seen in recent years, though the impact varies by property type.
Market Overview
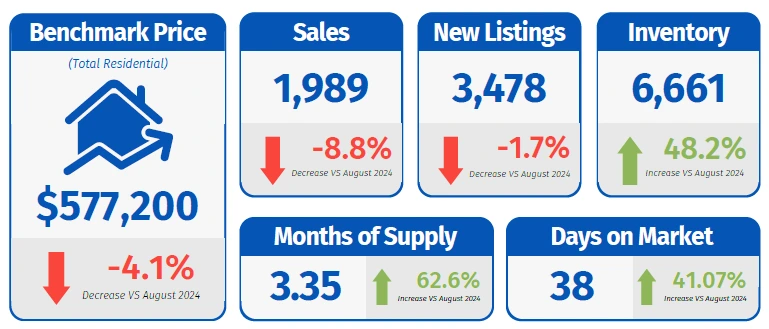
Sales: 1,989 (–8.8% vs. Aug 2024)
New Listings: 3,478 (–1.7% vs. Aug 2024)
Inventory: 6,661 (+48.2% vs. Aug 2024)
Benchmark Price: $577,200 (–4.1% vs. Aug 2024)
Days on Market: 38 (+41% vs. Aug 2024)
Months of Supply: 3.35 (up from sellers’ market levels)
Key Insight: Supply is expanding faster than sales, creating more balanced conditions. Price adjustments are most evident in apartments and row homes, while detached and semi-detached properties are showing smaller changes.
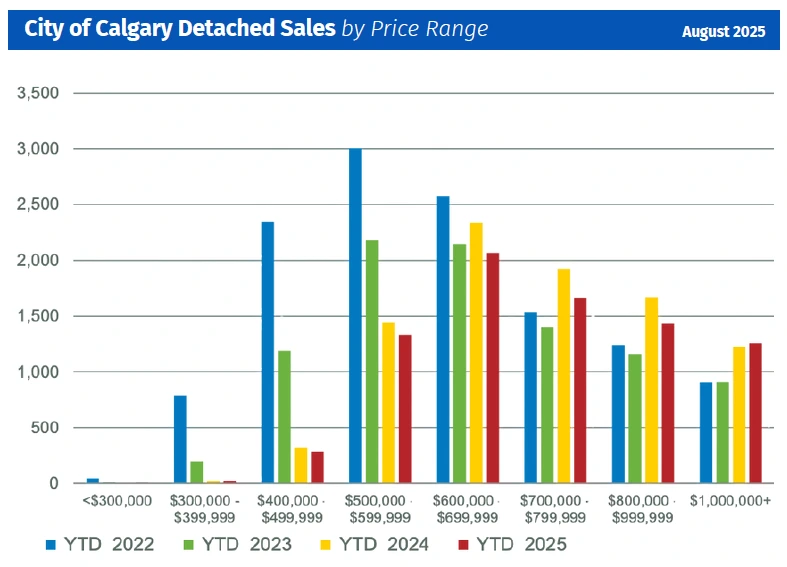
Detached Homes
Sales: 995 (slightly below last year)
New Listings: 1,748
Inventory: 3,051 (highest August since 2020)
Benchmark Price: $755,600 (–1% YoY)
Detached homes remain in demand but are normalizing. Price declines are steeper in the North East and East districts (–5%) but modest growth continues in the City Centre (+2%).
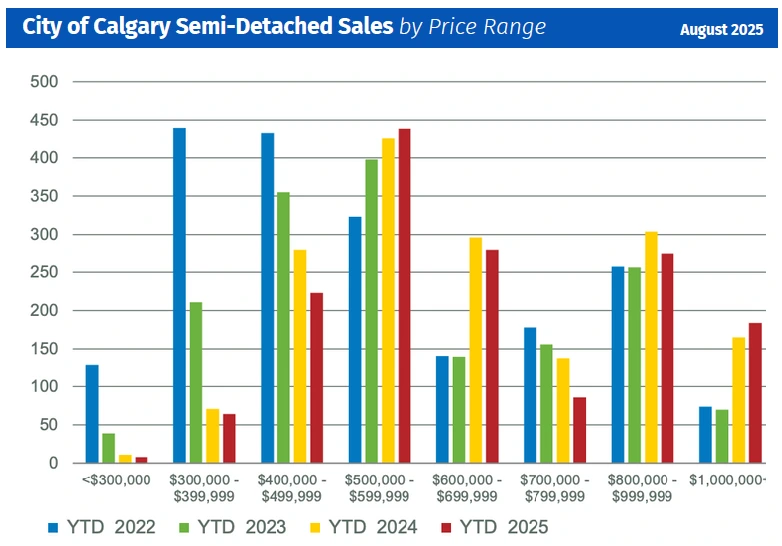
Semi-Detached Homes
Sales: 206 (up from 172 in Aug 2024)
New Listings: 309
Inventory: 528
Benchmark Price: $687,200 (+1% YoY)
This segment is holding firm, with a strong sales-to-new-listings ratio (67%). Lower inventory growth has kept prices relatively stable.
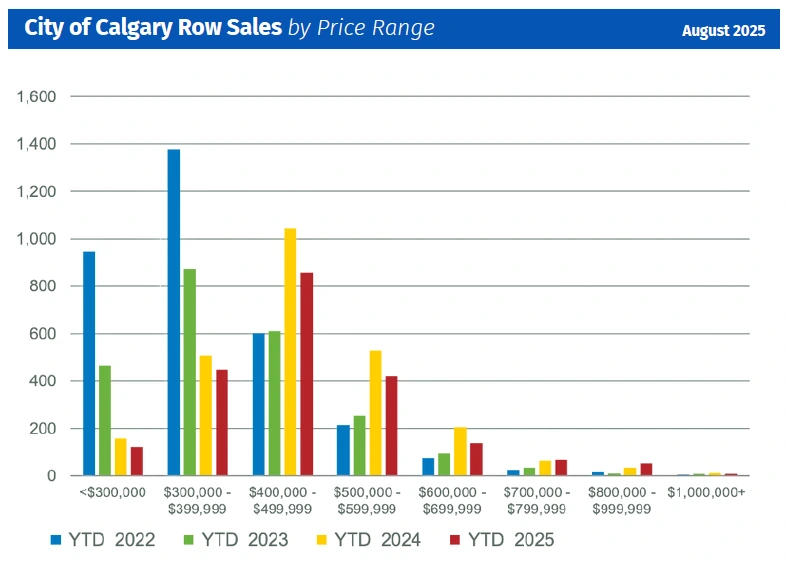
Row/Townhomes
Sales: 339 (down from 383 last year)
New Listings: 544
Inventory: 1,103 (second-highest August on record)
Benchmark Price: $439,600 (–5% YoY)
Row homes face pressure as supply grows, especially in the North, South, and East districts where resale and new builds are competing directly.
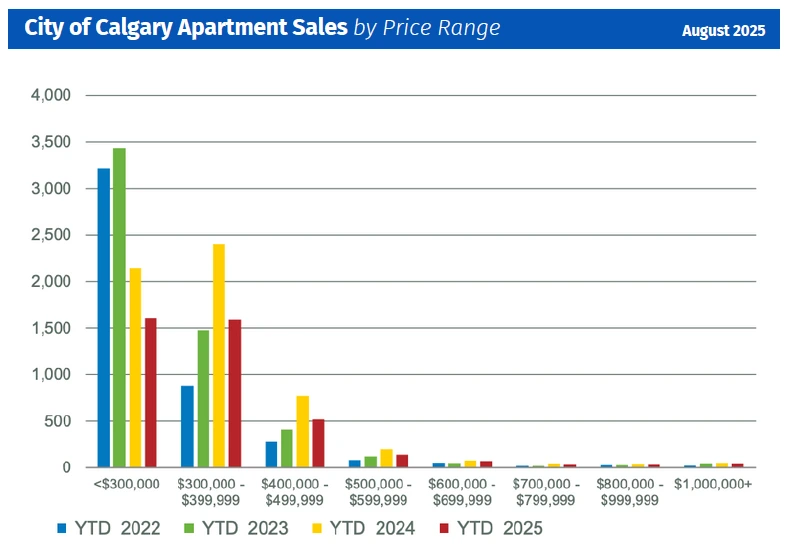
Apartments
Sales: 449 (down from 603 last year)
New Listings: 877
Inventory: 1,979 (highest August ever reported)
Benchmark Price: $326,500 (–6% YoY)
Apartment condos are seeing the sharpest corrections due to persistent oversupply. Most of the excess inventory is concentrated in the City Centre.
Surrounding Areas Snapshot
Airdrie: Benchmark $531,100 (–4% YoY); sales down –9.5%
Cochrane: Benchmark $589,100 (+1.8% YoY); inventory up 140%
Okotoks: Benchmark $621,500 (flat YoY); balanced market with 2 months of supply
Canmore: Benchmark $1,099,800 (+4.1% YoY); sales fell –30%
Key Takeaways
More inventory choice for buyers is softening prices.
Detached and semi-detached homes remain resilient.
Row and apartment markets are experiencing the biggest price adjustments.
Conditions are shifting from a seller’s market to a more balanced environment, though outcomes differ widely across districts.
Are you planning to buy or sell this fall? With Calgary’s market shifting, timing and strategy matter more than ever. Contact us today for tailored advice based on the latest data.
For a deeper look at how the Calgary real estate market performed in July, check out our July 2025 Market Summary.
Posted by Ray Yang on
Leave A Comment