Found 8 blog entries tagged as real estate stats.

Calgary’s real estate market continues to show dynamic movement as we head further into September. Following last week’s trends, new listings and sales activity reveal important shifts across all property types, offering insights for both buyers and sellers navigating the fall market.

Overall Market Snapshot

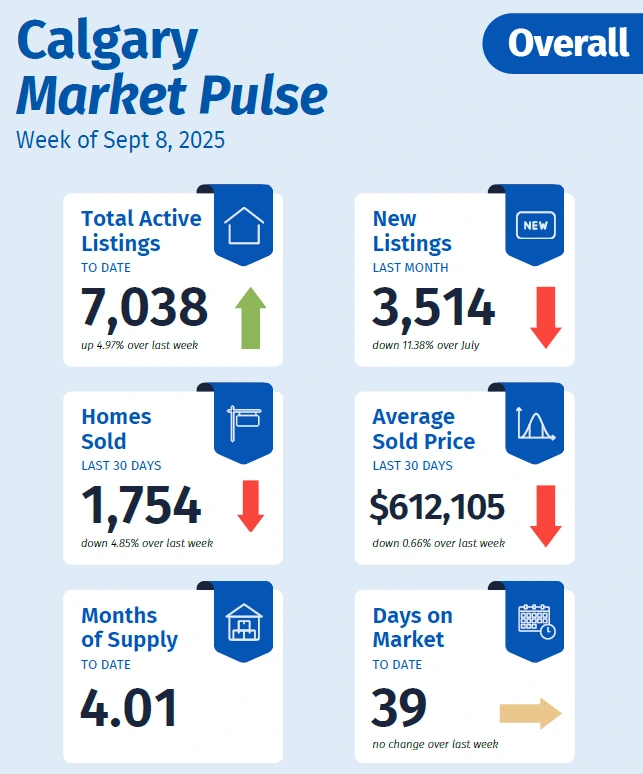
  • Total Active Listings: 7,217 (↑ 2.54% over last week)

  • Homes Sold (Last 30 Days): 1,725 (↓ 1.68% over last week)

  • Months of Supply: 4.18 (↑ from 4.12 last week)

  • New Listings (Last Month): 3,514 (↑ 0.90% over last week)

  • Average Sold Price (Last 30 Days): $617,595 (↓ 11.38% compared to July)

  • Days on Market: 40 (↑ 1 day over last week)

Key Takeaway: Active inventory is climbing while sales…

221 Views, 0 Comments

The Calgary housing market showed mixed signals this week as both buyers and sellers adjusted to evolving conditions. While active listings continued to grow, sales slowed in some property types, and absorption rates revealed diverging trends across housing segments. Here’s a breakdown of the latest data and what it means for Calgary homeowners, buyers, and investors.

Overall Market Snapshot

  • Total Active Listings: 7,038 (up 4.97% week-over-week)

  • Homes Sold (last 30 days): 1,754 (down 4.85%)

  • Months of Supply: 4.01 (up from 3.60 in August)

  • New Listings: 3,514 (down 11.38% from July)

  • Average Sold Price (last 30 days): $612,105 (down 0.66%)

  • Days on Market: 39 (no change)

Overall Calgary real estate trends for active listings, sales, and pricing as of September 8, 2025

Detached Homes:…

137 Views, 0 Comments

The Calgary real estate market shifted notably in August 2025 as higher inventory levels met softer sales activity. This balance is easing the seller-driven conditions we’ve seen in recent years, though the impact varies by property type.

Market Overview

Sales: 1,989 (–8.8% vs. Aug 2024)

New Listings: 3,478 (–1.7% vs. Aug 2024)

Inventory: 6,661 (+48.2% vs. Aug 2024)

Benchmark Price: $577,200 (–4.1% vs. Aug 2024)

Days on Market: 38 (+41% vs. Aug 2024)

Months of Supply: 3.35 (up from sellers’ market levels)

Key Insight: Supply is expanding faster than sales, creating more balanced conditions. Price adjustments are most evident in apartments and row homes, while detached and semi-detached properties are showing smaller changes.

Chart showing Calgary total sales, new listings, and inventory trends in August 2025.

160 Views, 0 Comments

As summer winds down, Calgary’s housing market remains active, though shifts are becoming more noticeable across property types. August 2025 data reveals trends in sales, inventory, and pricing that highlight where opportunities and challenges lie for both buyers and sellers.

Overall Calgary Market

  • Total Sales: 2,024 transactions
  • New Listings: 3,514
  • Active Listings: 6,704 homes on the market
  • Average Price: $609,070
  • Median Price: $563,150
  • Sales-to-New-Listings Ratio: 57.6%
  • Sales-to-List Price Ratio: 97.98%

This points to conditions that remain balanced but leaning toward sellers, with most homes still selling close to asking price.

Detached Homes

  • Total Sales: 996
  • New Listings: 1,748
  • Active Listings: 3,075

183 Views, 0 Comments

The Calgary real estate market continues to show signs of shifting dynamics across all property types. While sales remain steady, inventory levels and pricing trends reveal different stories for detached, semi-detached, row/townhomes, and apartments. Here’s your breakdown of the week’s key numbers.

Overall Market Snapshot

  • Total Active Listings: 7,048 (down 0.09% vs. last week)

  • New Listings (last month): 3,914 (down 6.0% vs. June)

  • Homes Sold (last 30 days): 1,958 (up 0.46% vs. last week)

  • Average Sold Price (last 30 days): $611,292 (down 0.25% vs. last week)

  • Months of Supply: 3.60

  • Days on Market: 38 (up 1 day vs. last week)

Takeaway: The overall Calgary market remains balanced, with stable…

40 Views, 0 Comments

Calgary’s real estate market remains balanced, with consistent demand across property types and modest price shifts. Here’s what happened in the past week.

Snapshot of the Week

Active Listings:

7,921 homes on the market — an increase of approximately 120 listings from the previous week, suggesting growing inventory.

Sales Volume:

Estimated around 2,000 homes sold in the past 30 days — consistent with recent activity levels.

Median Price Trends:

Overall median price sits near $569,500 — slightly lower than earlier summer figures. Detached homes are holding at about $705,000; semi-detached near $605,000; row homes around $434,500.

What Buyers & Sellers Should Know

If you're a buyer, the increased inventory opens up more…

28 Views, 0 Comments

The Calgary real estate market continued to show steady summer activity this past week, with balanced conditions in several property types and ongoing price stability across most communities. Here’s your breakdown of the latest numbers and what they mean for buyers and sellers.

Key Market Highlights

New Listings: 1,420 new properties hit the market this week, slightly down from the previous week as some sellers hold off until later in August.

Sales: 1,095 homes sold, a 3% week-over-week increase, indicating strong buyer demand despite mid-summer seasonality.

Average Price: The citywide average sale price held at $561,000, with detached homes continuing to lead gains.

Days on Market: Average DOM remained at 23 days, signalling a healthy pace…

78 Views, 0 Comments

As we move into the first week of August, let’s take a look back at how Calgary’s real estate market performed during the week of July 28, 2025. While summer activity remains steady, the latest trends show how different property types are reacting to shifting inventory and demand across the city. Here’s your recap of the key numbers and insights.

Market Stats at a Glance

Total Active Listings: 7,302 (↑ 1.4% from last week)

Homes Sold (Last 30 Days): 2,289 (↓ 2.0%)

Average Sold Price (All Types): $653,870 (↑ 0.4%)

Months of Supply: 3.1 – Balanced, slightly favouring sellers

Average Days on Market: 34 (↑ 1 day)

Detached Homes

Average Price: $844,900

Days on Market: 30

Absorption Rate: 44%

Trend: Detached homes remain in high…

37 Views, 0 Comments